Table of Contents
PINES Quick Reports Guide
Introducing PINES Quick Reports
Q: What is PINES Quick Reports?
A: PINES Quick Reports is a simplified, web-based interface to the existing Evergreen Reports module. It contains a pre-selected set of templates that produce frequently-asked-for report data. It is designed to be easy to use from the library staff perspective, with minimal training required.
It is not designed to take the place of the standard Evergreen Reports module, which will continue to be used by libraries that need custom reports.
Q: Who can use PINES Quick Reports?
A: Anyone who has the system permission to run reports in the staff client automatically has permission to run reports in PINES Quick Reports. Individuals with LocalAdmin or LibraryManager accounts automatically have permission to run reports. Other individuals may be given reports permissions by their library system’s designated Local Administrator. Specific permissions needed are: RUN_REPORTS and VIEW_REPORT_OUTPUT.
See also: Permissions
Launching PINES Quick Reports
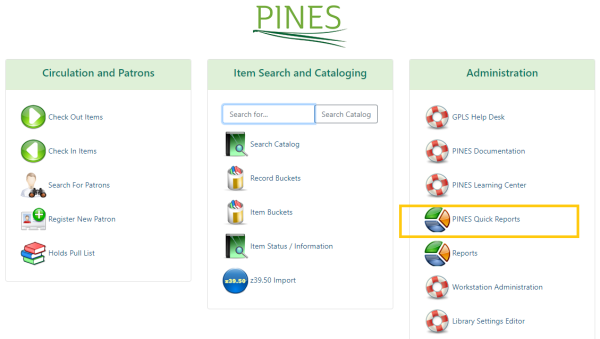
From the main screen of the Evergreen Staff Client, click on the PINES Quick Reports icon. This will open the interface in a web browser window. Log in with the same username and password you use to log in to the Evergreen Staff Client. (Please note that if you use a username for your account, logging in with your barcode will not work.)
Alternatively, you can open your web browser and go directly to: http://gapines.org/report-creator
Running a Report
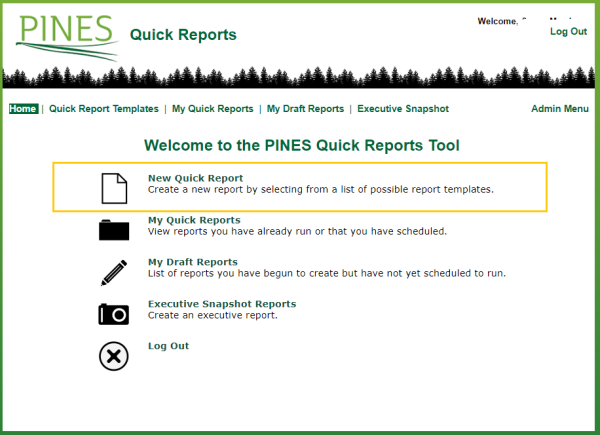
1. Select either the New Quick Report option from the home page or the Quick Report Templates option from the top menu to begin your first report.
2. Click on the name of a report category (Bills, Circulations, Holds, Items, Patrons) to view the types of reports available in that category.
3. To learn more about each report, click on the Description link. This will open a pop-up window describing what information the report will produce, followed by a technical description of what the report will display and the report filters. Click the ‘X’ to close the pop-up window.
4. Click Create a Report to open the report template.
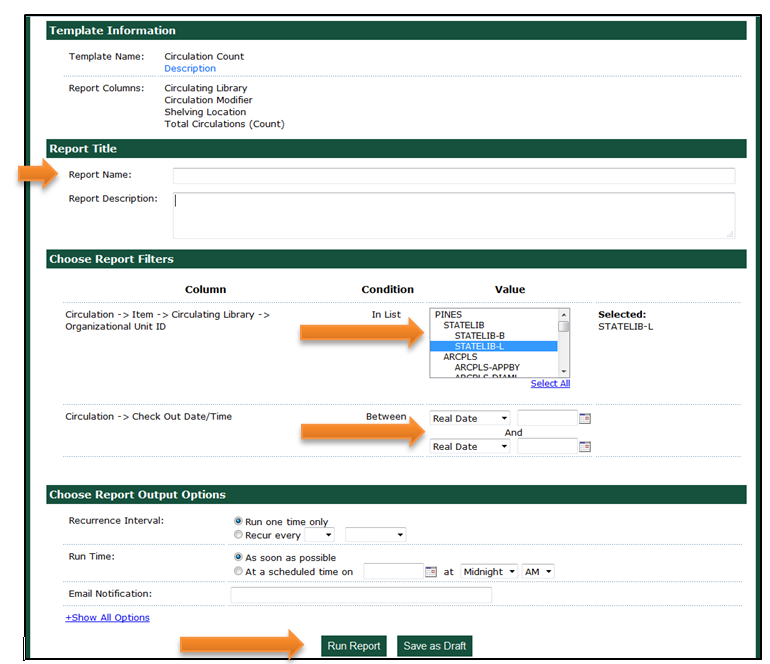
5. Type in a Report Name of your choice and fill in the Choose Report Filters options. It is a good idea to make the Report Name as descriptive as possible so that you may easily identify it in a list of reports. The Report Filters will be different for each template but will often ask you to choose which library/libraries the report is for (CTRL-Click to select multiple branches), and will often ask you for a date or range of dates. You may occasionally be asked for specific Circ Modifiers, Shelving Locations, Patron Permission Groups, etc.
6. Click Run Report to submit your report to the server to be processed.
Other Report Template Options
Report Description: This is an optional field that you can use to store information about the report for later reference (such as the person who asked you to run the report, the reason why you ran the report, why you chose the filter options you did). This information will not appear on the report output.
Report Output Options – Recurrence Interval: If you just wish to run the report once, leave the default as “Run one time only.” If you wish the report to automatically run on a scheduled basis, change the option to “Recur every” and choose from the dropdown options for a number of days/weeks/months.
Report Output Options – Run Time: If you wish to run the report immediately, leave the default as “As soon as possible.” If you wish to run it overnight or on another day (particularly if you are scheduling a repeating report), then choose the “At a scheduled time on” option.
If running system-intensive reports that take a significant amount of time (particularly weeding reports), it is a good idea to schedule them to run overnight.
Email Notification: If your account profile has an email address associated with it, it will be automatically filled in. You may remove it, change it, or add multiple email addresses separated by commas. When the report is ready, the system will send an automated email notification with a link to the report results to any email address listed there.
If you send the report to someone else using this function, the person receiving the message will need to have an account with the VIEW_REPORT_OUTPUT permission enabled in order to open the report results. If you need to send the report to someone else that does not have Evergreen reports permissions, then you can save the resulting Excel file to your local drive, and then attach it to an email to distribute.
Output Options: To see this option, click “Show All Options.” By default, your report will be created in Excel (preferred by most users) and HTML (for viewing in the browser). Depending on your needs, you may also choose CSV (comma-separated values), and you may choose to have it create simple bar and/or line charts with the HTML output as well.
Pivot Label Column and Pivot Data Column: To see these options, click “Show All Options.” Use these to change the layout of the resulting report output (for example, have the labels display on the side instead of the top).
Save as Draft: If you begin filling out a report form and wish to stop and return later to finish filling it out, you may use the “Save as Draft” option. To complete it at a later time, click on the My Draft Reports menu option and click “Edit Report.”
Viewing Your Report Results
1. Click on My Quick Reports to see the list of your reports that you have already run, that are currently running, and that you have scheduled to run in the future.
2. Click on the Category of your report. The reports are organized in the same categories as the templates (Bills, Circulations, Holds, Items, Patrons).
In the example shown here, the “Shelf List of STATELIB-L” report is scheduled to be run. “Item list” and the following reports have already been run.
If a report is scheduled and has not yet been run, you have the option to Cancel Report or Edit Report (change options such as the email address to which you wish to send the notification).
If a report has already been run, you have the option to view the report (by clicking on the report title), to Run Again (this will allow you to change the selected filters and notification options), or to Delete Report (which removes it from your list).
3. View your completed report by clicking on the report title. A new browser tab will open and may prompt you for your Evergreen login name and password. After you log in, you will be presented with viewing options.
If you chose the default report output options, you will see a page with links to Tabular Output (HTML, viewed in the browser screen) and to Excel Output. Most people prefer to view the results in Excel because they are able to take advantage of Excel’s sorting and calculating functions to further organize data and create charts. These functions can also be performed by opening the Excel file in Google Sheets. Doing so also allows for easy report sharing.
Barcodes in Excel
The one small issue with using Excel is that it does not know how to display long numbers such as barcodes properly, so you may see columns of data that say “5.07E+13” or similar. To display these numbers correctly, see: Formatting Long Numbers in Excel
Access Through the Standard Reports Module
If you wish to modify these reports for your own library’s use, you may clone them through the standard reports module in the Evergreen Staff Client from Shared Folders > Templates > QRADMIN > Simple Reporting Tool.


